UX
User Experience: Artist in Blunderland

Mixing Science in an Artist World

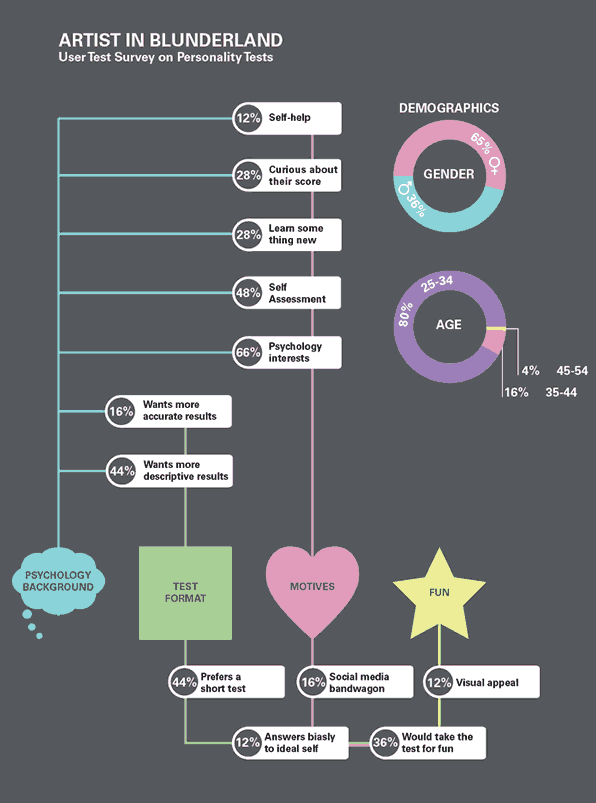
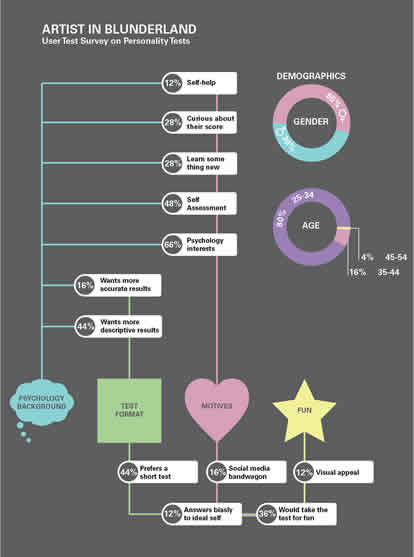
This web application caters to current and prospective students at (AAU) Academy of Art University, San Francisco. Interviews, surveys, and user testing were conducted to evaluate which features are effective for the target audience.

Learning about neuroscience and psychology would be the last thing on an artist mind. Data visualization was the answer to explain a complex concept and appeal to a visually inclined audience, art students.

Challenges:

  • How can the artist comparison personality test retain user engagement?
  • How can the charts’ personality theory explanation be entertaining?

Overall Solution:

  • Storytelling
  • Translating scientific terminology and test scores to relatable art student terms

UX
Surveys and Candy Bribery

User Research Involves Going Outside of Your Comfort Zone

The web application features artist comparison scores and demographics which are based on AAU student survey participants. Convincing art students to fill out surveys was no easy feat.

The school’s organization, Campus Life, graciously let me set up a booth at their social events. A database was built from scratch for the online survey and calucatling psychometrics.

Incentives included:

  • Candy favors
  • Target and Starbucks raffle giveaways
Survey Promotional Flyer
Flyers were passed out throughout campus and social events.
Survey Schwag
Free candy favors to go along with the flyers.

UX
Target Audience

Primary

Primary Target Audience

Personal Profile:
High School Student
Gender, Age:
Female, Eighteen
Goals:
College-bound, seeking to possibly attend an art school

Secondary

Secondary Target Audience
Personal Profile:
Working Professional
Gender, Age:
Female, Late Twenties to Early Thirties
Goals:
Contemplating to get a second degree in art

Tertiary

Tertiary Target Audience
Personal Profile:
Current Academy of Art Student
Gender, Age:
Male, 18 to Early Twenties
Goals:
Contemplating whether to change majors

UX
Archetypes

Primary Archetype

Hometown:
Hong Kong, Hong Kong
Age:
Eighteen
Goals:

Joni is beginning her last year in high school in a few months. She is contemplating whether she wants to attend AAU after graduating.

She is curious to know the demographics of AAU and whether there will be any students from her hometown in her major.

"Studying abroad is exciting and scary at the same time. It would be nice to familiarize with the school’s demographic and cultural lifestyle."

Secondary Archetype

Hometown:
San Mateo, CA
Age:
Thirty-Five
Goals:

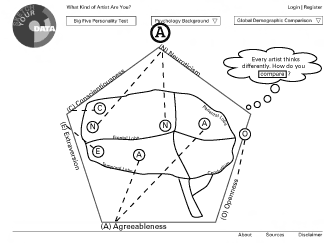
Marie is a human resource manager who is thinking about changing her career into the art field.

Before she takes the web app test, she questions the content’s validity. She wants to know the psychology source of this personality test.

"Getting a second degree is like getting a second chance to truly acheive what you want to do in life."

Tertiary Archetype

Hometown:
Stockholm, Sweden
Age:
Twenty
Goals:

Hugo is a current AAU student and is contemplating in changing his major. He wants to compare himself to another major at AAU.

"There are so many interesting art disciplines out there. I’m still figuring out which one is my niche."

UX
User Testing — Home Page Storytelling

  • Before: Simply Charts without a Storyline

    Low Fidelity Sketch Your Data Wireframe

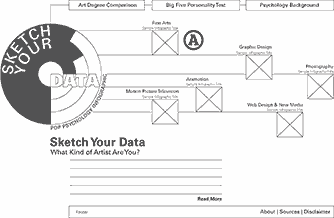
    The web application was originally called, “Sketch Your Data,” where the charts would “sketch” and plot your personality score. It simply had charts with no storyline.

    The test users would easily go through the test process, but found the home page very dull and boring.

    A
    Examples of cropped images of different graphs from a test score result

  • Before: Children Literature

    High Fidelity Artist in Blunderland Wireframe

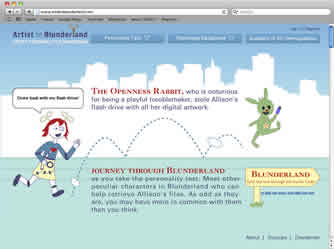
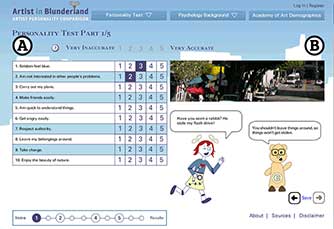
    “Artist in Blunderland” story plot is similar to “Alice in Wonderland.” The main character, Allison, roams around San Francisco and meets peculiar pedestrians along the way. These characters represent each personality trait of the personality theory, the Big Five.

    Some users were intrigued by the story, but there were comments that the story seems to be more for children.

  • After: Alice In Wonderland Theme

    Personality Trait Character Names

    A storyline of "Artist in Blunderland" was added to make it more fun to learn about the "Big Five." The story is a spin-off from "Alice in Wonderland."

    Each character represents a personality trait as listed below:

    B
    Conscientiousness Bear

    C
    Neurotic Barista

    D
    Agreeableness Twins

    E
    Extraverted Bird

    F
    Openness Rabbit

  • After: Simplified Characters and College Slang

    Personality Trait Character Nicknames

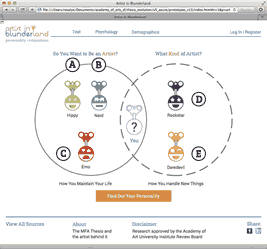
    Artist in Blunderland had many different characters in the previous iteration. The new storyline has characters that are wind-up toys to represent "the gears" in the brain.

    The character names were also simplified and changed to slang words that college art students can relate to as listed below:

    A
    Hippy (Agreeableness)

    B
    Nerd (Conscientiousness)

    C
    Emo (Neurotic)

    D
    Rockstar (Extravert)

    E
    Daredevil (Openness)

UX
User Testing — Personality Test Format and Unraveling the Storyline

  • Before: The Story Unravels as the Test Progresses

    Low Fidelity Test Wireframe Low Fidelity Test Wireframe

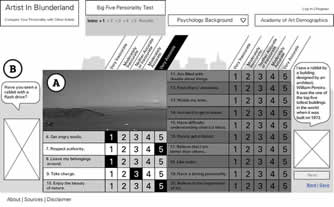
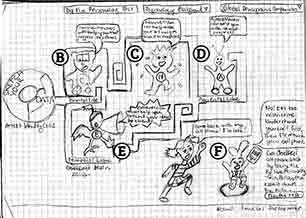
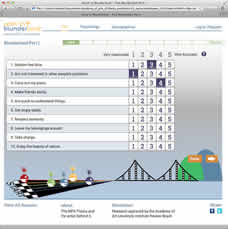
    The test format had four pages. Each page showed a progression to the story of "Artist in Blunderland."

    A
    On each page there are four quadrants of test questions. When the user finishes one quadrant, it reveals part of the underlying background image.

    B
    The main character, Allison, is having a conversation with one of the pedestrians she met. Their conversations give hints about the hidden background image.

    C
    When the user is done with all four quadrants, it reveals the hidden background image that ties into the story. The user can now proceed to the next pages and will eventually discover new hidden images and obtain the complete story of Artist in Blunderland.

    The test users thought the layout was complicated with too much content on one page.

  • Before: Complicated Storyline with Different Characters

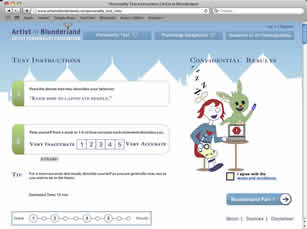
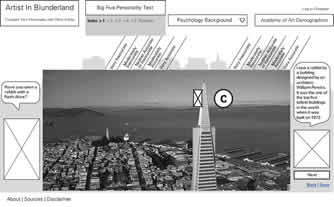
    The storyline starts off at the test instructions page where the white rabbit steals Allison’s flash drive. This prompts Allison to chase the white rabbit around the city. The test users found the storyline distracting while taking the test. They were already occupied taking the personality test and distracted by trying to interpret the story on the side.

  • After: The Story Separated from the Test Format

    A
    The test was separated from the storyline.

    B
    The images and dialogue changes as the user completes the questions.

    However, the test users could not see the direct connection with the test and the story.

  • After: Simplified Story and Simplified Characters

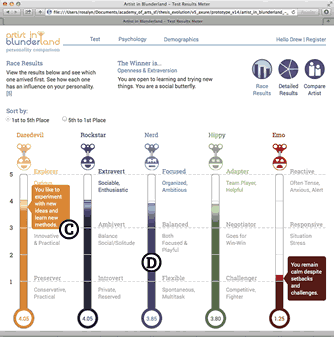
    The storyline was simplified with windup toys where they race throughout the city of San Francisco. The order of the windup toys at the finish line represent the degree of which personality trait scored higher than the other. The simplified storyline did not take away the test users’ attention when taking the test.

UX
User Testing — Personality Test Score Results with Meaningful Charts

  • Before: Scientific Terms on a Radar Graph

    Low Fidelity Individual Score Wireframe

    A
    The scientific personality traits labeled the graph. The test users found the scientific labels and the radar graph unappealing.

    B
    The test scores were initially shown purely numerical and plotted on a chart. The farther away the plot is from the center, the less the user is influenced by that trait. Many test users preferred some kind of supplementary interpretation of the score.

  • Before: Artist Comparison with a Radar Graph

    Low Fidelity Comparison Score Wireframe

    A
    The radar graph also shows the average score per art major with the user’s own score.

    B
    The different colors represent each of the different art disciplines. The overlap of the plots were difficult to distinguish the difference in between scores.

  • After: College Slang on a Bar Graph

    High Fidelity Individual Score Wireframe

    C
    The summary score result used the storyline to explain how the character (personality trait) would most likely work in an art studio environment. The narrative was more relatable than the plain plotted scores.

    D
    The test users were able to interpret the bar chart faster than the radar graph.

  • After: Scattered Plot with a Separate Radar Graph

    Comparison Chart High Fidelity Comparison Score Wireframe

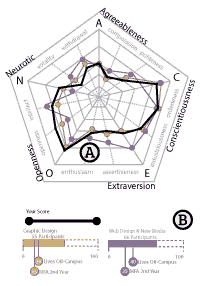
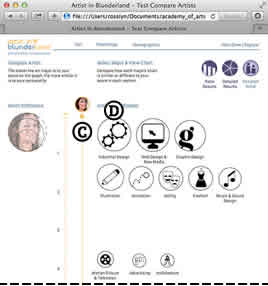
    The user can view all the art major scores all at once with this bubble chart without overlap. This makes it easier to view multiple majors at once.

    C
    The larger the circle and further to the top of the chart, the more similar the art major score is to the user.

    D
    The user can select an art discipline to view its comparison score on a separate modal window.

    E
    The placement of additional information were tucked away which kept charts simple and more view options for the users.

UX
User Testing — Psychology Background with Brain Charts to Wind-Up Toys

  • After: Brain Mechanics as Wind-Up Toys

    Big Five Aspect Scale Hiearchies

    B
    The lighthearted windup toys symbolize the mechanics of the brain and each personality trait. The test users were more engaged to learn about the personality theory that was less intimidating than an image of the brain.

    C
    The user can reveal or conceal information as he/she selects the different circles on this graph.

  • After: Categorized Self-Expressions by Hashtags

    The Lexical Hypothesis and Twitter Hashtags

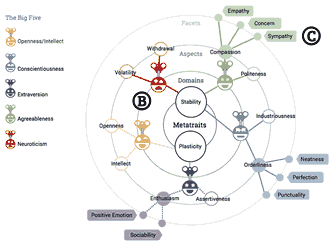
    The Big Five Personality Traits came from the Lexical Hypothesis, where human language has an underlying meaning on how to describe a person. The Lexical Hypothesis used dictionary terms.

    C
    Twitter hashtags were used to illustrate how hashtags described human personality, which is a modern twist to the lexical hypothesis.

    D
    After the user selects a hashtag, a bird would reveal a Twitter feed that list all the tweets with those hashtags.

    The hash tag symbolism for categorized human expressions were much easier for test users to grasp since they use it on a daily basis.