UI
User Interface: Artist in Blunderland
Aspiring Artist and College Bound? Great! Now, which Art Discipline?
Pursuing art as a career is risk taking in an incredibly competitive field. Deciding what to major in is another feat. According to national statistics, 50% college freshmen knew what to major in. However, 50-70% changed their major one to three times before graduation.
Familiarizing with oneself can be self-assuring in an unfamiliar territory, especially for those who are changing careers. A personality test is one way to familiarize your own skills.
Unlike most rigid personality tests, my MFA thesis is a personality test that shows the user their combination of each personality trait based on the (BFAS) Big Five Aspect Scale personality theory. It also compares the user and displays how their personality fits in with their potential classmates, which is based on a data set of the (AAU) Academy of Art University student body.
UI
Personality Theory and Chart Layout Improvement
Before: Original Linear Layout
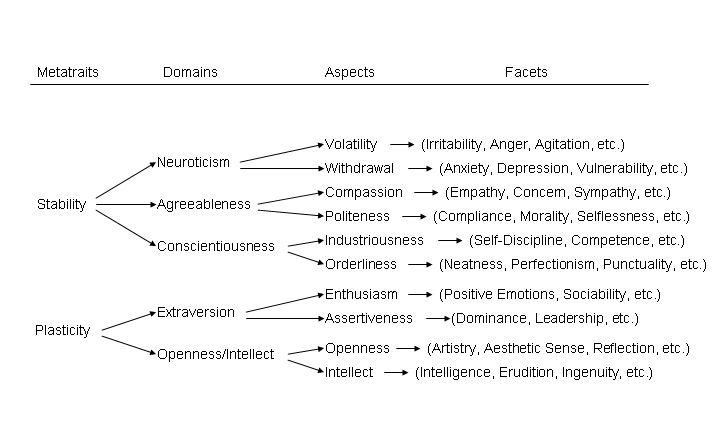
The personality test is based on the neuroscience research, (BFAS) Big Five Aspect Scale, conducted by an associate professor of University of Minnesota, Colin G. DeYoung. His ongoing research is on the brain functionality and its influence on personality.
DeYoung’s original chart shows the four-level of personalities in a linear format. It is straightforward, but too plain to the target audience, art students.
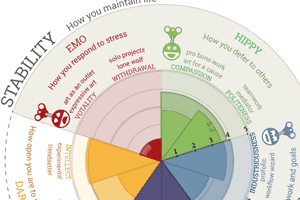
After: Improved Circular Hierarchy Layout
The four-level hierarchy are laid out in a circular fashion to show a more unified approach versus the original linear chart style.
During user testing, users found the scientific terminology on the circular chart dull and boring. Windup toys were later added to the chart to represent the mechanism of the brain on the next iteration. After adding playful characters, users found the chart more appealing.
UI
UI Personality Traits — What’s In a Name?
Scientific Name vs. Artists' Personalities
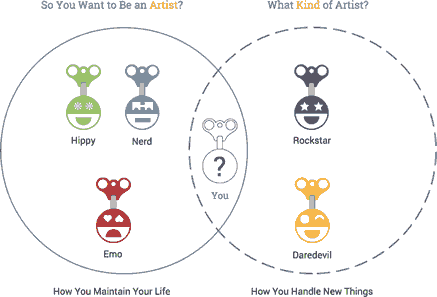
Before: The wind up toys kept their original scientific names and definition in the early stages of iteration. Test users liked the windup toy character, but could not relate to the scientific terminology.
Before: The wind up toys kept their original scientific names and definition in the early stages of iteration. Test users liked the windup toy character, but could not relate to the scientific terminology.
Neuroticism
Expressionist
Emo
Agreeableness
Artist with a Cause
Hippy
Conscientiousness
Pixel Perfect
Nerd
Extraversion
Influential Trendsetter
Rockstar
Openness
Experimental Innovator
Dardevil
After: The labeling and scientific definitions were changed to college slang as shown in the chart above. Test users perceived the new labeling more fun and light-hearted.
After: The labeling and scientific definitions were changed to college slang as shown in the chart above. Test users perceived the new labeling more fun and light-hearted.
UI
Data Visualization & Psychometrics
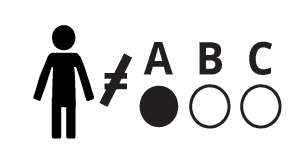
Many personality tests are very rigid with its score results. We are complex and too sophisticated to be pigeon-holed into one category.
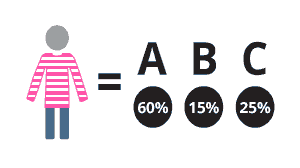
BFAS is based on numerical results which is easily shown using data visualization. This web application showcase individual and artist comparison scores in an interactive chart.
UIData Set — Student Demographics
A Diverse Community Makes a Diverse Learning Experience
Studying abroad is a great way to explore and learn new cultures. It also can be intimidating to dive into unfamiliar territory.
Prospecting students can preview what their potential classmates’ demographics are and how they will fit in the bigger picture by using the demographic section of this web application.
Note: The data set is sparse due to limited source of participating students. The charts are for prototype reference only.
UITask Flow
User Case Scenario
The user is a prospective art student that is interested in attending Academy of Art, San Francisco, but is indecisive on which program to enroll. The user thought this personality test would be a fun way to compare oneself with other artists.
Task Flow 1
The user wants to understand the psychology background before taking the test. Later, the user decides to save their progress midway through the test.
Task Flow 1 Mobile
The user wants to understand the psychology background before taking the test. Later, the user decides to save their progress midway through the test.
Task Flow 2
The user completes the saved test and compares their score with other artists.
Task Flow 2
The user completes the saved test and compares their score with other artists.